Just like Google maps, DNA maps can tell us the distance between two genes, and allow us to zoom in on the region of interest. DNA mapping started with human genome project, where DNA sequencing techniques opened a way to unveil the genetic information. However, determining the unique places and repetitions of four “chemical letters” found in our DNA—together known as the genes—is a difficult mission due to temperature, pH, and pressure sensitivity of the molecule. DNA mapping technology allows for easy identification of large structural variations in DNA and therefore provides long-range information of the genome and can more.
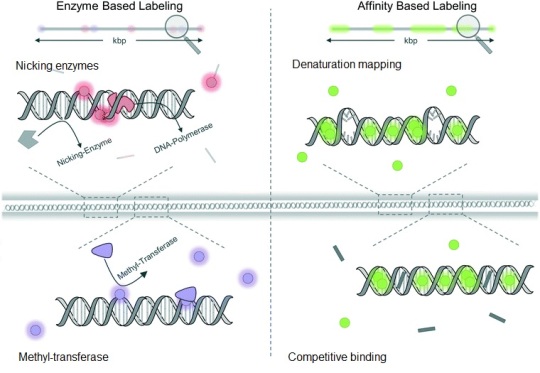
Optical DNA mapping has emerged in the past decade as a powerful alternative to other DNA sequencing techniques since it can easily be applied with reduced risk of DNA damage. Over 100000 basepairs of DNA molecules, which are quite difficult to handle with other techniques, are labeled, stretched, and rendered in a single image. The stretching part is done using nanochannels (and therefore lab-on-a-chip technology), while the labeling part can be done by either enzymatic or affinity-based techniques (Figure 1). The concept and applications of optical DNA mapping has recently been very well explained in a tutorial review written by Vilhelm Müller and Fredrik Westerlund from Chalmers University of Technology in Sweden.
In enzymatic labelling nucleotides at particular regions on a single DNA strand are replaced by new ones using a DNA polymerase. The replacement nucleotides are then utilized to incorporate fluorophores into the DNA strand and allow for visualization. Nicking enzymes and methyl-transferases present two different approaches to employ enzymatic labelling process. While the use of differently colored fluorophores extends the applicability of this technique, the final resolution depends on the degree of stretching and the density of fluorophores on the region.
Affinity-based labelling is based on non-covalent interactions which can be enabled by either denaturation mapping or competitive binding. In denaturation mapping, DNA is heated to discriminate between the bases by their different bond energies. While G-C-basepairs still hold both strands of DNA—due to 3 hydrogen bonds holding them—, A-T-basepairs will melt—due to 2 hydrogen bonds holding them—. At this stage, an intercalating fluorescent dye can be linked to G-C-basepairs, allowing for imaging. Competitive binding relies on the usage of a fluorescent intercalating dye and a molecule selective for either A-T or G-C regions. Therefore, fluorescent dye cannot bind where the selective molecules have already bound. An optical map of DNA molecules can be obtained in this way. Affinity-based labelling is also highly dependent on the degree of stretching.
Optical DNA mapping techniques are useful tools for a wide range of applications from assembly of complex genomes to bacterial plasmid epidemiology. The concept opens up exciting research directions as it allows for automation of whole analysis using lab-on-a-chip systems and observation of the results using smartphones.

Figure 1. Schematic illustration of DNA labelling techniques used in optical DNA mapping. Enzyme-based labelling involves nicking enzymes and methyl-transferases techniques, while affinity-based labelling can be employed by denaturation mapping or competitive binding methods. This figure is adapted from “Optical DNA mapping in nanofluidic devices: principles and applications” paper.

